Someone who knows what he is talking about.
Sunday, November 25, 2007
Managing Risk Using Options
You might be interested in Protective puts: Long stock position and long puts in equal quantity as a hedge to your portfolio.
Posted by
Unknown
at
6:29 PM
0
comments
![]()
![]()
CF Chart
OBV increasing as the stock is going down means buyers are buying the dip.
EMA is calculated using average close.
As long as the stock does not break 78, it is a buy.
Posted by
Unknown
at
5:09 PM
0
comments
![]()
![]()
Saturday, November 24, 2007
50-Day Moving Average Spread At Lowest Level Since 3/03
Hope for the DOW?
Posted by
Unknown
at
10:52 PM
1 comments
![]()
![]()
Friday, November 23, 2007
Is a Bear Market Developing?
I am not a bear, but I don't ignore the facts. It's a must read.
Posted by
Unknown
at
10:33 PM
3
comments
![]()
![]()
Sunday, November 18, 2007
This is why I use Firefox with NoScripts Add-ons
I have the ability to allow / ignore JS on the page.
I understand bloggers make money via advertising.
But WTF! Make it unobtrusive versus in your face.
UNOBTRUSIVE
IN YOUR FACE
Posted by
Unknown
at
10:19 AM
4
comments
![]()
![]()
Shocked, Surprised, Pleased, Ecstatic.
Hey Beanie,
Thanks for adding me to your blogroll.
Please be aware that I don't blog very much.
The main reason I put up this site is to justify my mad reasonings at Beanieville
I got tired of putting up the same information in the comments section so I put it here.
Posted by
Unknown
at
9:53 AM
0
comments
![]()
![]()
Thursday, November 15, 2007
Monday, November 12, 2007
Shorting Against the Box
That is a very good article to read.
Here is an example.
You purchased 100 VMW @ 114.
VMW breaks support @ 104 can could possibly go to 96/93/85/82/73.
You don't want to sell VMW because you are already down 10 pts. But then if you hold it, it can go down further.
What you can do is short 100 VMW @104.
You MINIMUM loss is 10 points. Your maximum loss is unlimited.
Let's say you cover VMW at 84.
This wll give you 20 pts gain on the SHORT and 30 points loss on the LONG, net 10 pts loss.
HINDSIGHT IS 20/20.
No one could predict how low VMW can go. But if you look at the charts, the possibility of the stock falling to a price is more likely as the stock continues to break support and does not reverse course.
How many of your drives a brand new car paid for in cash and not have full coverage?
Posted by
Unknown
at
7:54 PM
1 comments
![]()
![]()
Labels: .
Saturday, November 10, 2007
Point and Figure Charts @ www.chrisperruna.com
Chris has a very good write up about P&F charts with an exercise.
While you are there, you can read about Market Corrections, Bears and the Big Picture
Another good site The Power of the 200ma
Posted by
Unknown
at
8:33 AM
0
comments
![]()
![]()
Friday, November 9, 2007
Monday, November 5, 2007
Saturday, November 3, 2007
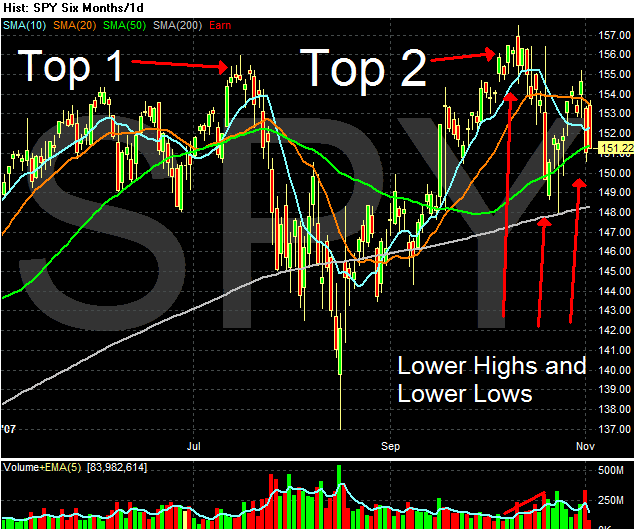
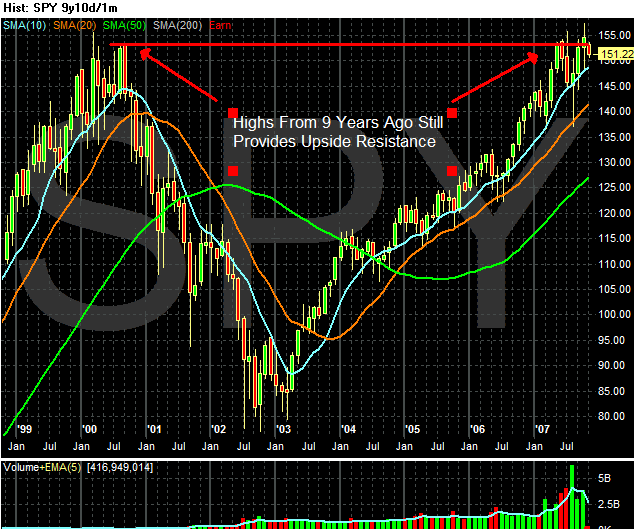
The Bonddad Blog: Two Charts of the SPYs That Should Cause Some Concern
Posted by
Unknown
at
8:48 AM
1 comments
![]()
![]()
Friday, November 2, 2007
Significant Numbers To Watch
| 13021 | - | Support, the 9/10/07 low |
| 13603 | - | 50-day simple moving average |
| 13161 | - | 200-day simple moving average |
| 13359 | - | 50% retracement of the 08/16/07 low to the 10/11/07 high |
| 1439 | - | Support, the 9/10/07 low |
| 1503 | - | 50-day simple moving average |
| 1479 | - | 200-day simple moving average |
| 1473 | - | 50% retracement of the 08/16/07 low to the 10/11/07 high |
| 2536 | - | Support, the 9/10/07 low |
| 2663 | - | 50-day simple moving average |
| 2560 | - | 200-day simple moving average |
| 2610 | - | 50% retracement of the 08/16/07 low to the 10/11/07 high |
Posted by
Unknown
at
7:13 PM
0
comments
![]()
![]()
11/02/2007 Charts
How to play the market.
When there is fear, buy QLD.
When there is greed, hedge by buying 20% SDS and 20% DXD.
Example: If you have 10,000 invested in QLD, hedge by buying 2,000 SDS and 2,000 DXD.


Posted by
Unknown
at
7:04 PM
0
comments
![]()
![]()
Thursday, November 1, 2007
QQQQ, QLD, QID
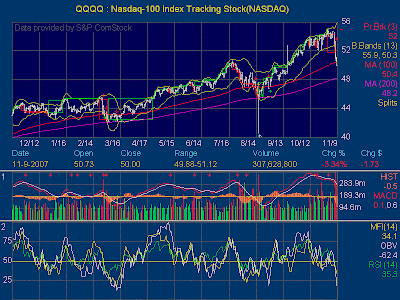
Notice how close the price came to the weekly BB for QQQQ before today's reversal.
QQQQ
| Date | Open | High | Low | Close | Volume | Adj Close* |
| 1-Nov-07 | 54.68 | 54.77 | 53.97 | 54.00 | 181,936,900 | 54.00 |
| 31-Oct-07 | 54.47 | 55.07 | 54.04 | 55.03 | 148,350,800 | 55.03 |
QLD
| Date | Open | High | Low | Close | Volume | Adj Close* |
| 31-Oct-07 | 119.80 | 122.75 | 117.93 | 122.47 | 3,310,500 | 122.47 |
| 30-Oct-07 | 117.96 | 120.46 | 117.68 | 118.75 | 2,324,400 | 118.75 |
QID
| Date | Open | High | Low | Close | Volume | Adj Close* |
| 1-Nov-07 | 34.40 | 35.23 | 34.28 | 34.98 | 35,948,900 | 34.98 |
| 31-Oct-07 | 34.71 | 35.24 | 33.80 | 34.04 | 34,286,700 | 34.04 |
Posted by
Unknown
at
5:45 PM
2
comments
![]()
![]()


