In my previous post, I wrote about trend trading using the 200ma.
Here I want to show you charts of BVN, the love the left without me.
P&F Chart shows bad price objective, but notice the reversal.
Stock is below 200ma which normally means avoid.
But short term indicator was great and missed opportunity.
What do you see in the above chart?
If you are a frequent reader, then you know my sayings.
What happened? How did I lose track of this stock? I failed to differentiate between short term and long term trend and lost focus. While long term trend can be down, short term trend can turn up.
Since you made it this far, here's something for you to enjoy,
That's Nha Trang Beach in Vietnam.
Friday, July 22, 2011
Flexible Conflict
Posted by
Unknown
at
5:31 AM
View Comments
![]()
![]()
Monday, July 11, 2011
Trend Trading
Is trend trading that easy?
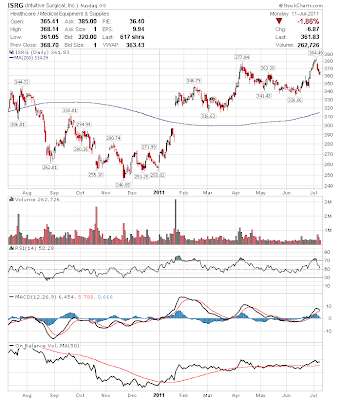
BUY when 200sma slope is positive and stock crosses above 200sma.
SELL when 200sma slope is positive and stock crosses above 200sma.
CAREFUL when 200sma slope is negative.
I have not back tested the strategy; hence, I don't know how effective it is.
If it was that easy, then why most money managers cannot even beat the index.
Easy in hindsight, isn't it?
Here are some 1year charts for you to look at. 


Posted by
Unknown
at
6:05 PM
View Comments
![]()
![]()
Subscribe to:
Comments (Atom)


